Self-Similarity Interpretation Guide
This guide provides an overview of the self-similarity search algorithm developed in our recent research, currently available as a preprint.
Self-similarity histograms provide a means of assessing heterogeneity within datasets.
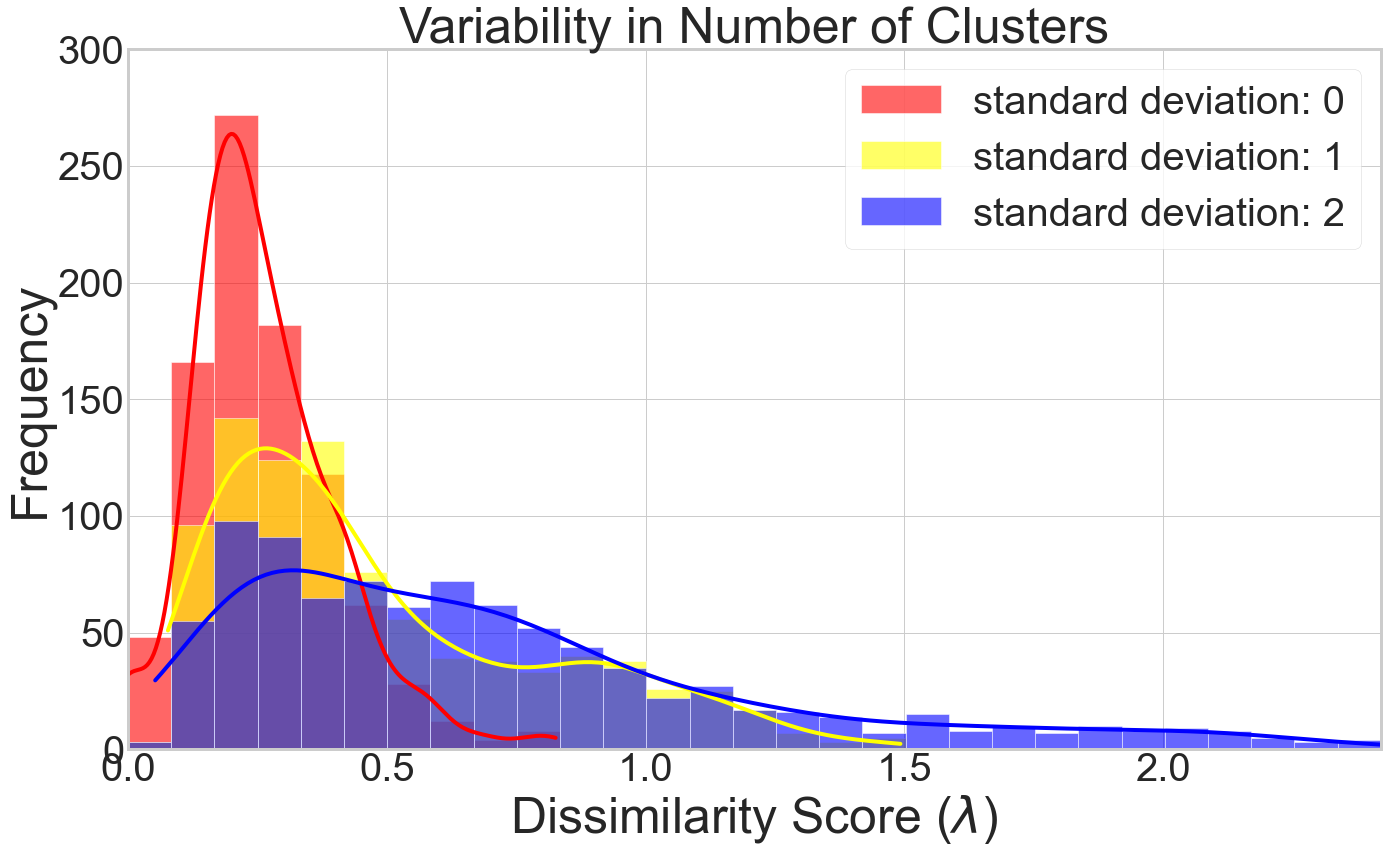
- Homogeneous datasets exhibit narrower histogram distributions with lower average dissimilarity scores.
- More heterogeneous datasets are characterised by broader distributions and higher average dissimilarity scores. This trend is illustrated in Figure 1, where increasing standard deviations indicate greater heterogeneity.
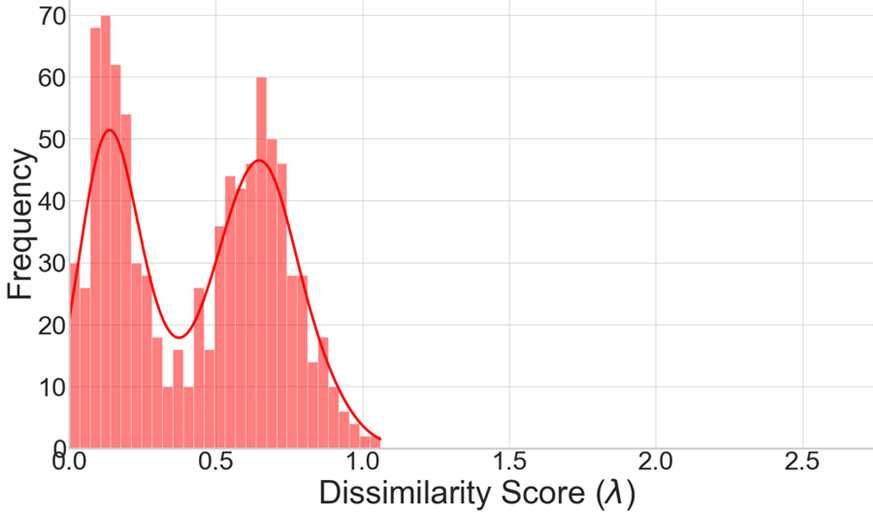
Additionally, self-similarity histograms can reveal distinct sub-populations within cells, such as variations in protein spatial organisation at the cell centre versus the cell periphery. These sub-populations manifest as multiple peaks in the self-similarity distribution (see Figure 2).