User Guide
We present a publicly accessible, curated, and functional resource, termed "nano-org", containing single-molecule localisation microscopy (SMLM) data representing the nanoscale distributions of proteins in cells. Nano-org is searchable by comparing the statistical similarity of the datasets it contains. This unique functionality allows the resource to be used to understand the relationships of nanoscale architectures between proteins, cell types, or conditions, enabling a new field of spatial nano-omics. Please refer to our paper for a detailed view of the science behind this website.
Contents
Home Page
The homepage is designed to help you quickly access key features of nano-org. Below is an overview:
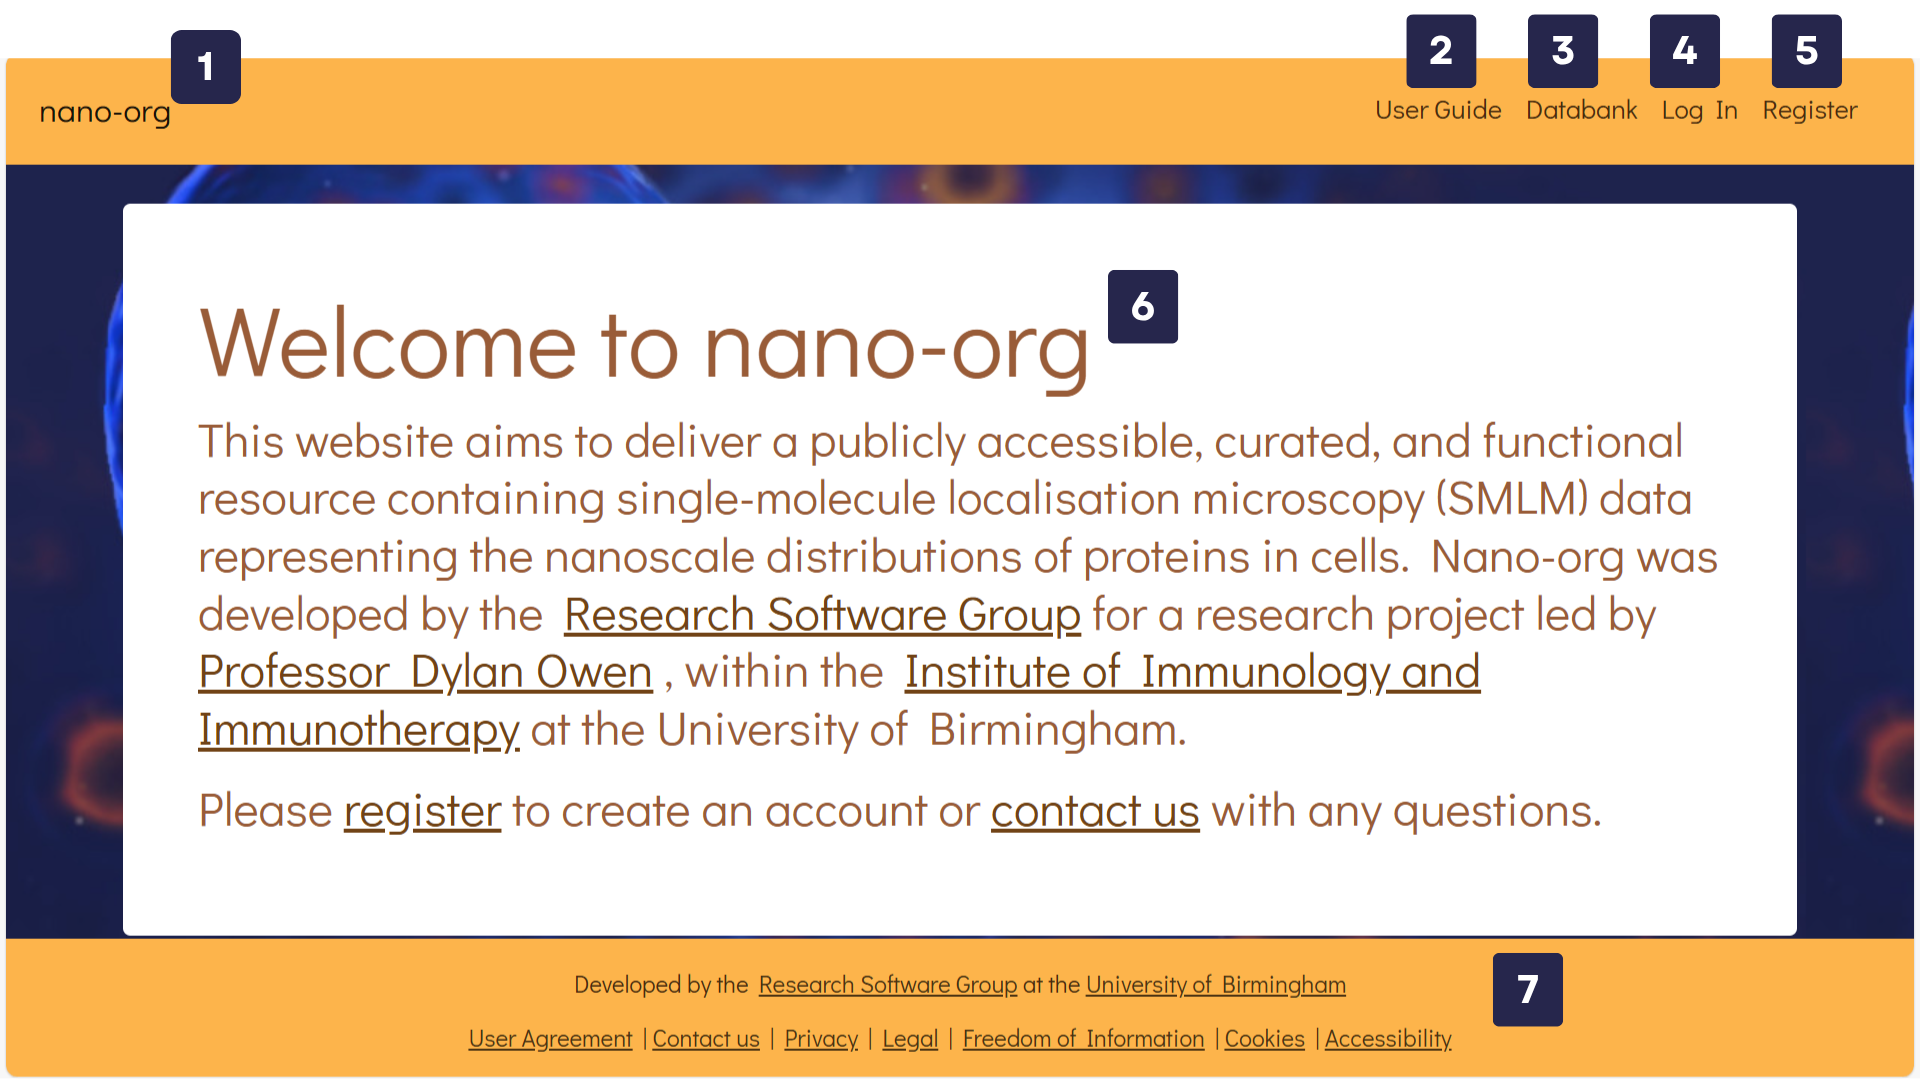
- nano-org: Link to the homepage. This is part of the navigation bar and is accessible from every page.
- User Guide: Opens the User Guide, which provides an overview of the nano-org website and its core functionality.
- Databank: Directs you to the Databank, where all user-uploaded datasets are stored. This section is explained in more detail below.
- Log In: For users who are already registered. Logging in unlocks additional features, such as uploading and sharing your own datasets.
- Register: If you are interested in joining the nano-org community and contributing your own datasets, please register to create an account.
- Welcome Message: Provides a brief introduction to the website and includes helpful links for getting started.
- Footer: Contains important legal information and contact links.
Viewing Data
The Databank tab on the navigation bar leads you to the Public Database of nano-org. Users have uploaded their datasets and have shared them publicly. Below is an overview:
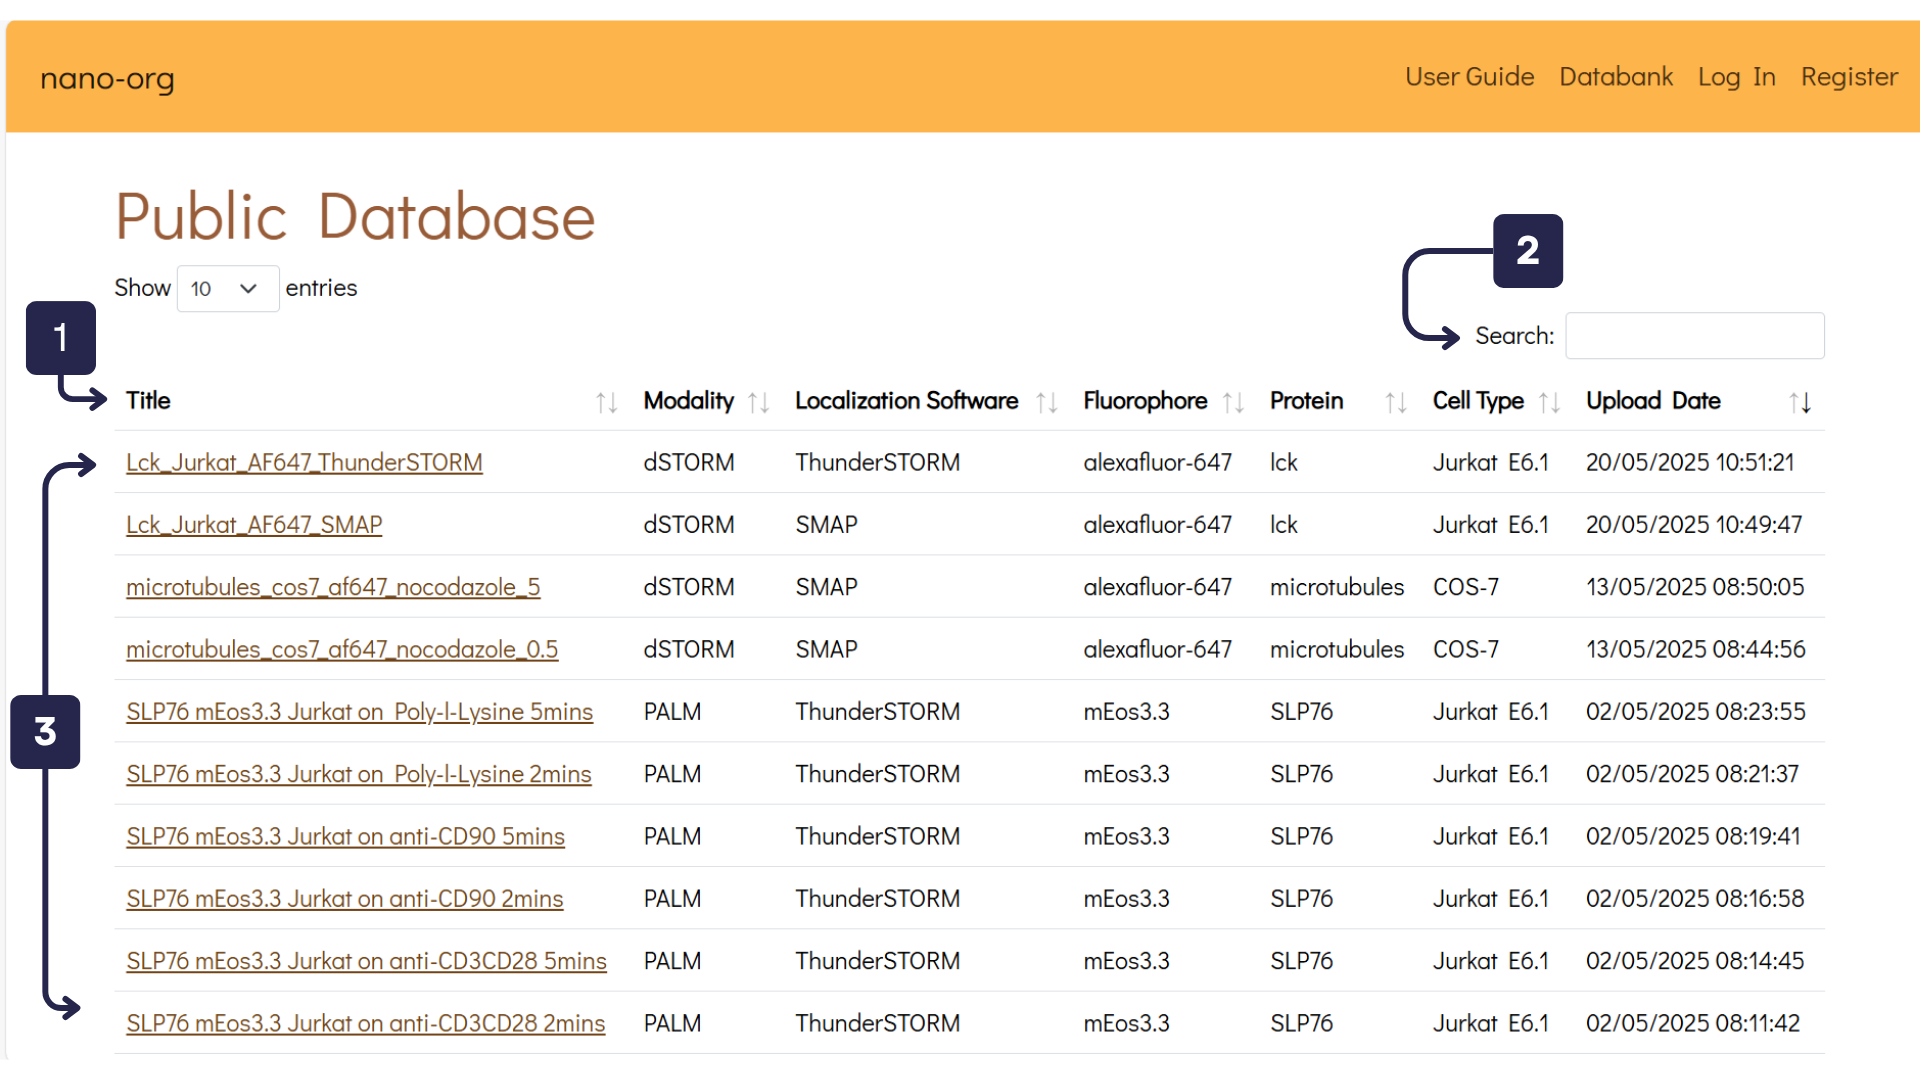
- Table Headings: Click the arrows next to each heading to sort the database by its associated metadata.
- Search Bar: Use this to search for specific datasets or metadata tags.
- Datasets: Each user-uploaded dataset is listed here under a user-defined name. Clicking a dataset will take you to a detailed view with analysis and metadata.
Clicking on a dataset (as shown in item 3 above) takes you to the related Dataset Details page, which is illustrated in the next image. Here, you can explore the features of an individual dataset in more depth. In the following example, the dataset PrimaryCD8_TIGIT is used for illustration.
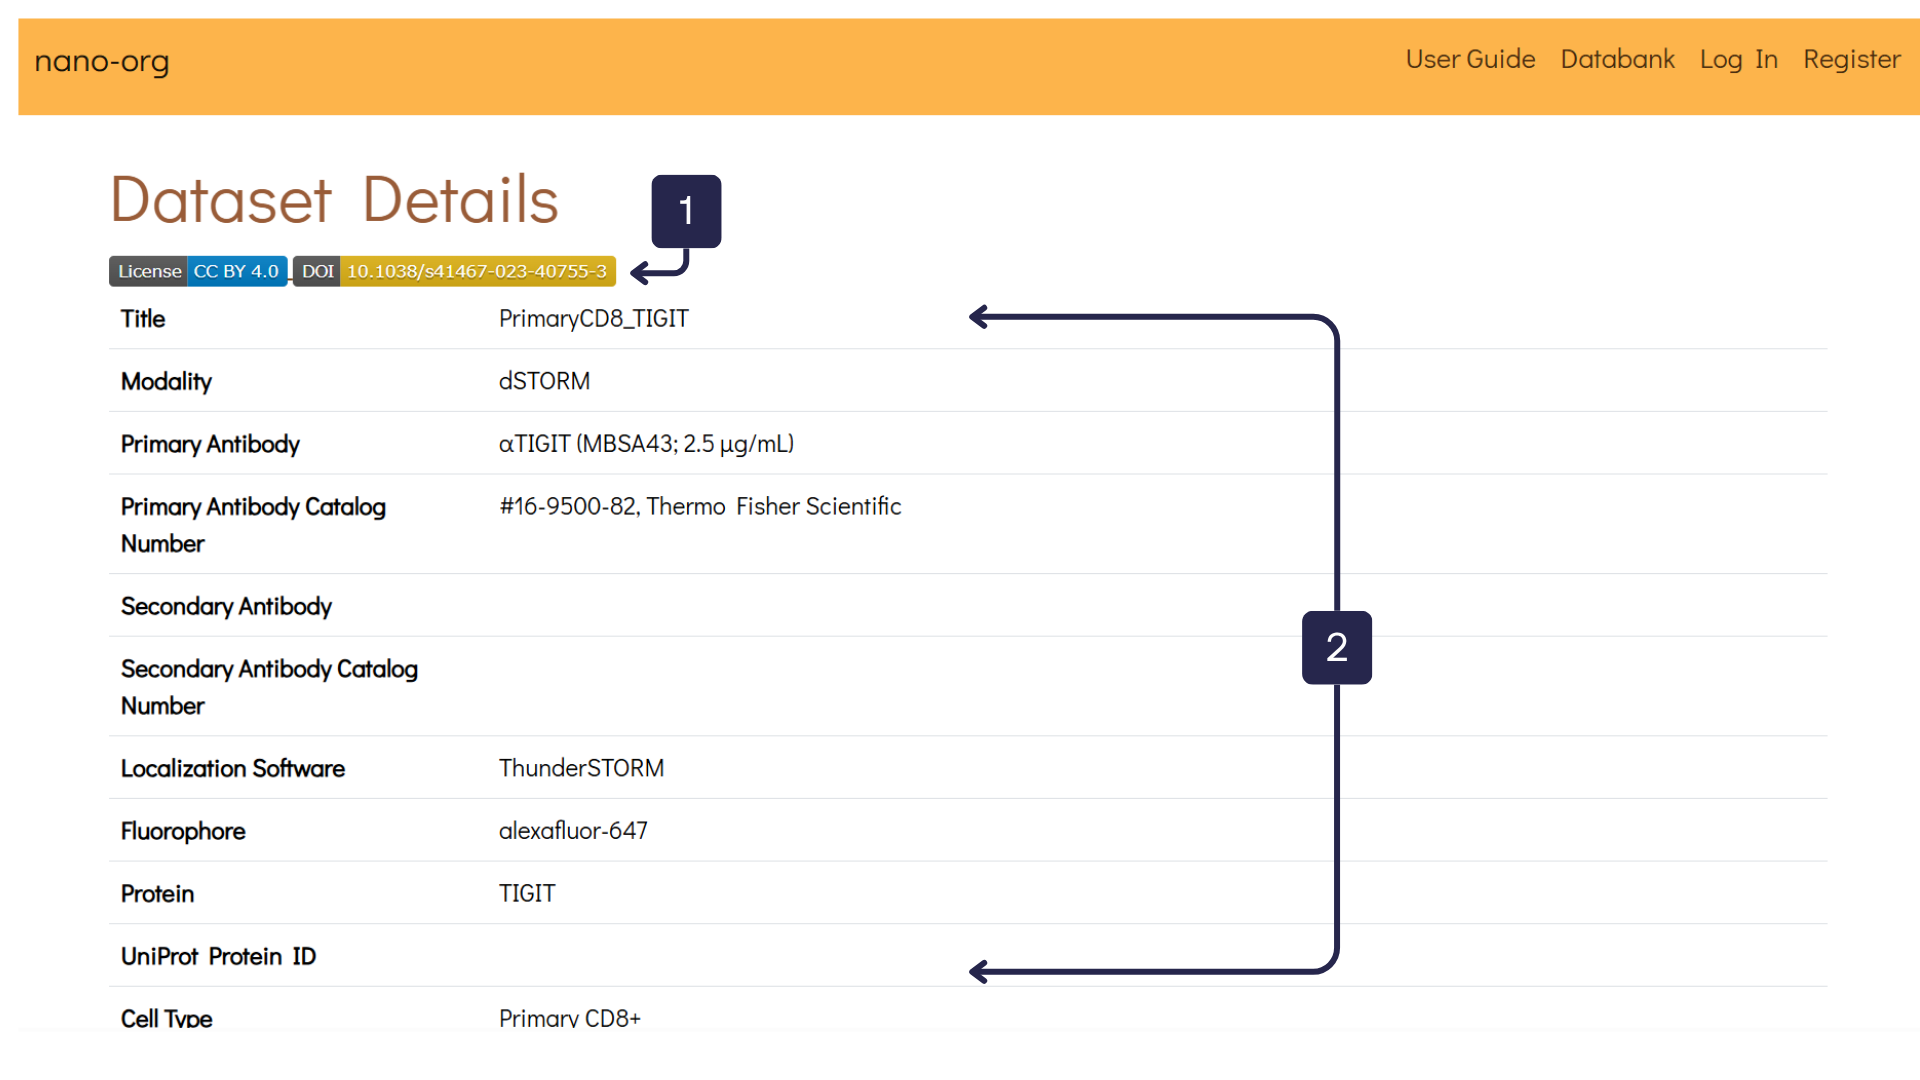
- Dataset Links: Users may provide links to related resources, such as licences, publications, or external repositories associated with the dataset.
- Dataset Table: This table displays all metadata submitted by the user during upload, offering a detailed overview of the dataset’s attributes.
As you scroll down, you'll reach the second section titled Data Files, shown in the image below. This section provides options to download dataset files and view analysis for individual data files:
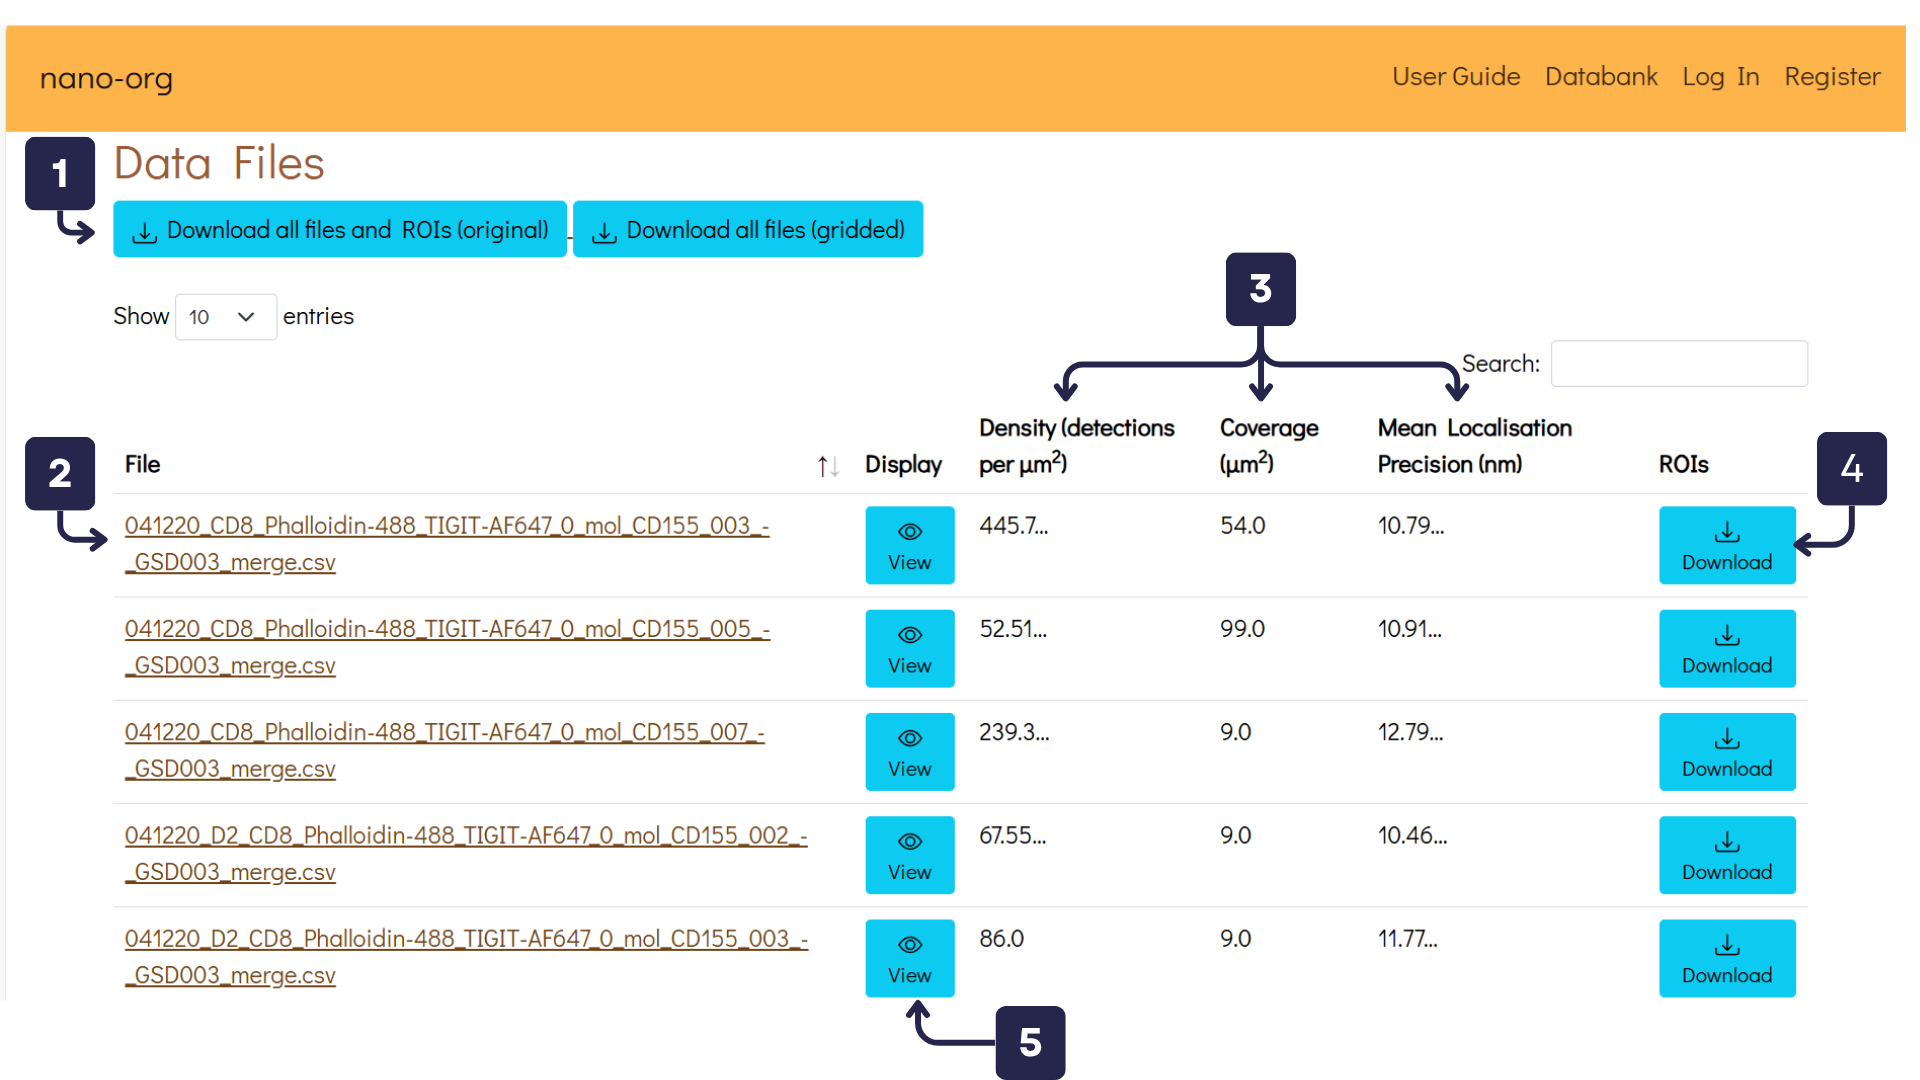
- Download Buttons: Registered users can download original data files, gridded data files and PNG images of the dataset.
- Individual Data Files: Provides direct download link for each individual localisation file within the dataset (registered users only).
- Column Headers: Displays localisation density, coverage and localisation precision values for each localisation file.
- Download ROIs: Registered users can download Regions of Interest (ROIs) files, which contain the XY coordinates for the cell-bounding polygon.
- View Data File and Analysis: Opens a detailed view of the selected localisation file, including cluster analysis results (Ripley and DBSCAN).
As you scroll down, you'll reach the section titled Self-Similarity Histograms. Here, we display histograms generated using a self-similarity search algorithm developed in our recent research. These histograms provide a valuable tool for assessing heterogeneity within datasets.
The image below presents self-similarity histograms for both the thinned (left) and unthinned (right) datasets.
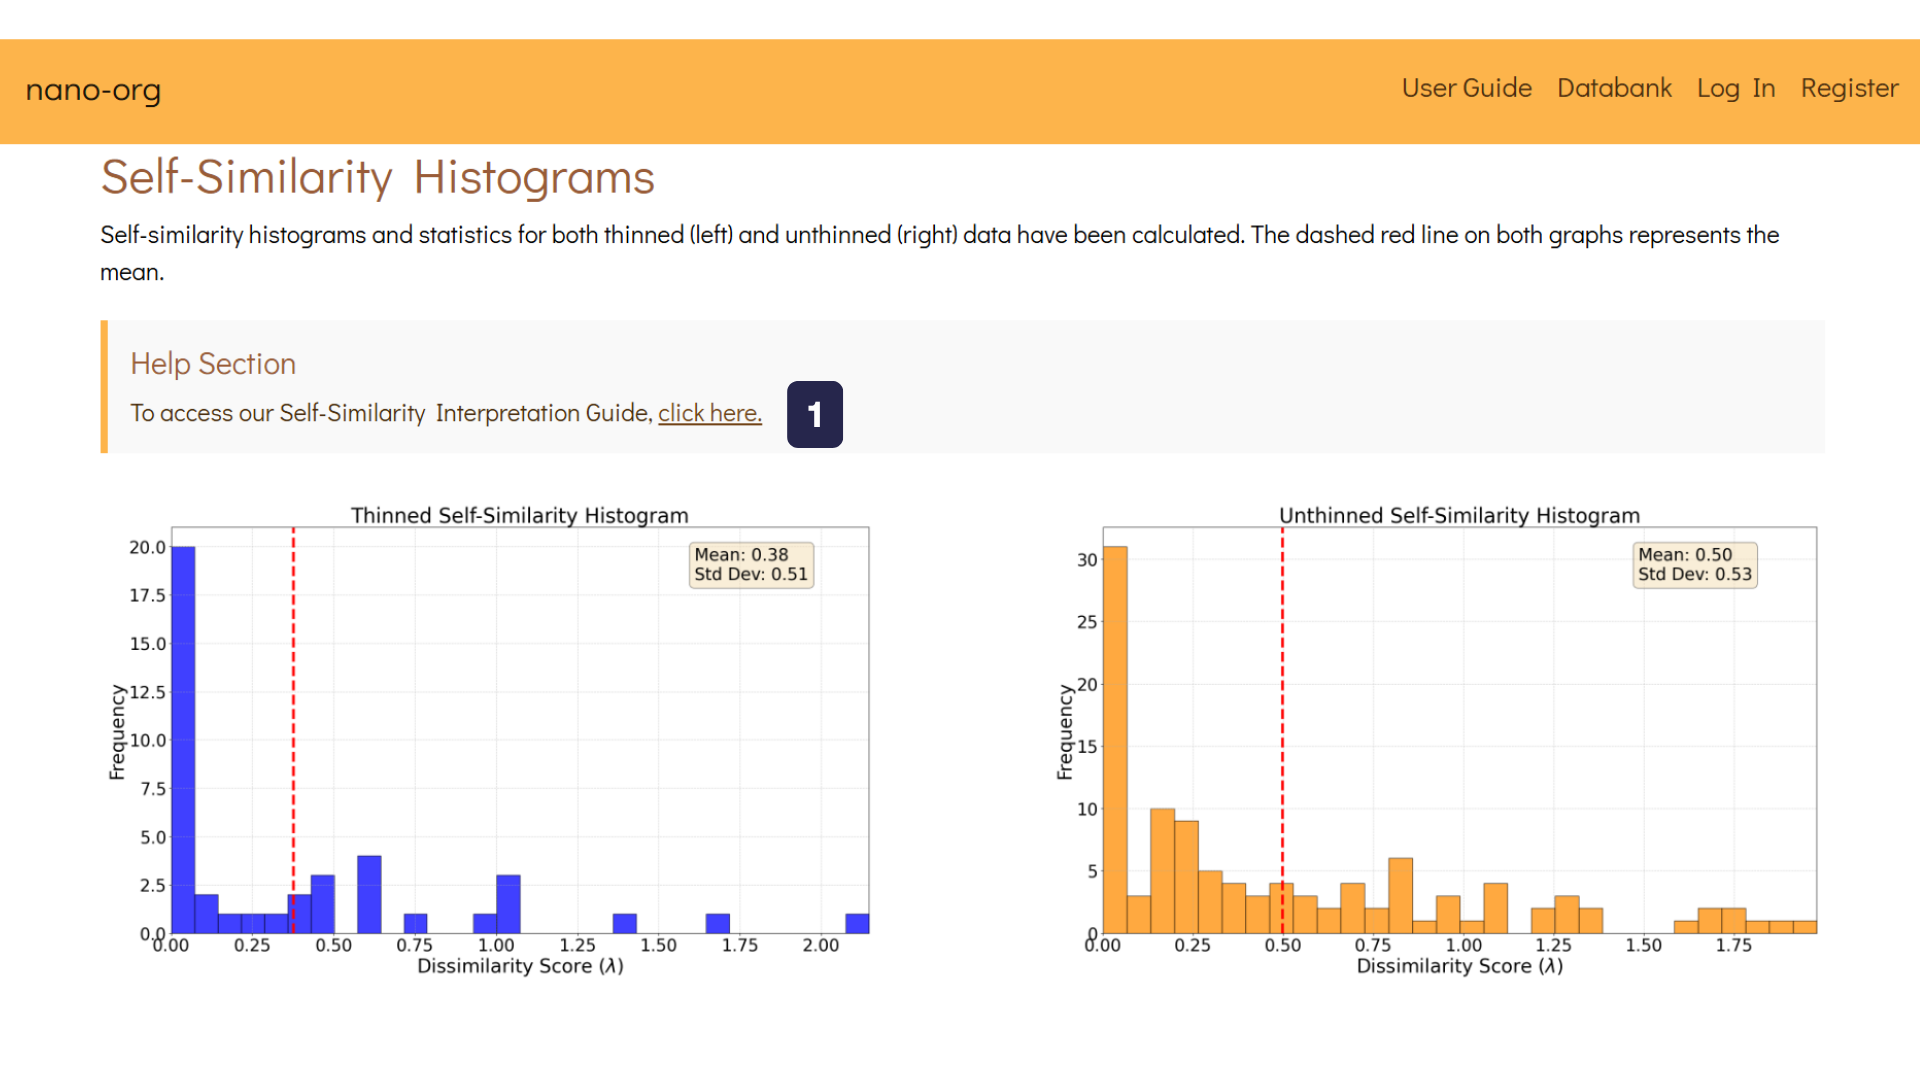
- Help Section:To understand further about our self-similarity algorithm, there is a Self-Similarity Interpretation Guide where we explain how you can interpret the histograms for the dataset.
The Similarity Search Results section presents the calculated dissimilarity scores. This section allows you to compare your dataset to other publicly available datasets.
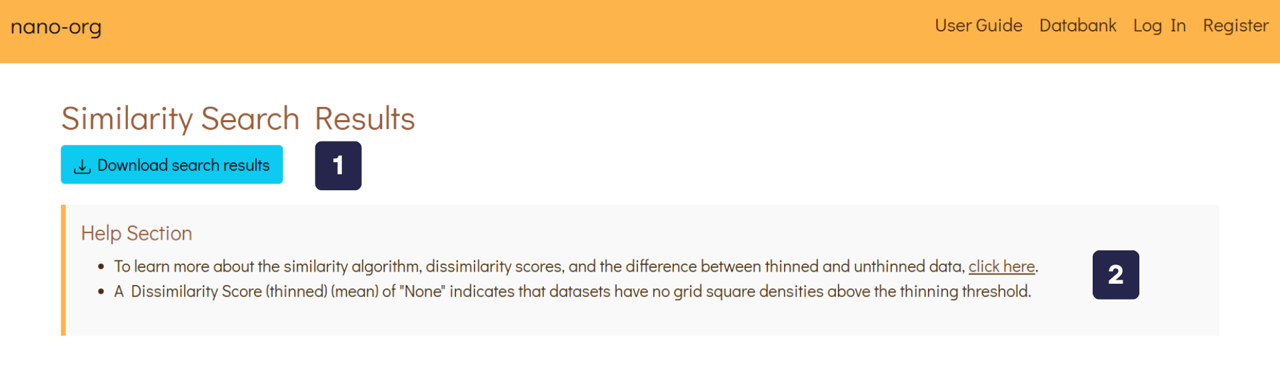
- Download Button: Registered users can download similarity results for further analysis.
- Help Section: To explore our similarity algorithm in detail, refer to the Similarity Search Interpretation Guide, where we explain how to analyse the dissimilarity scores.
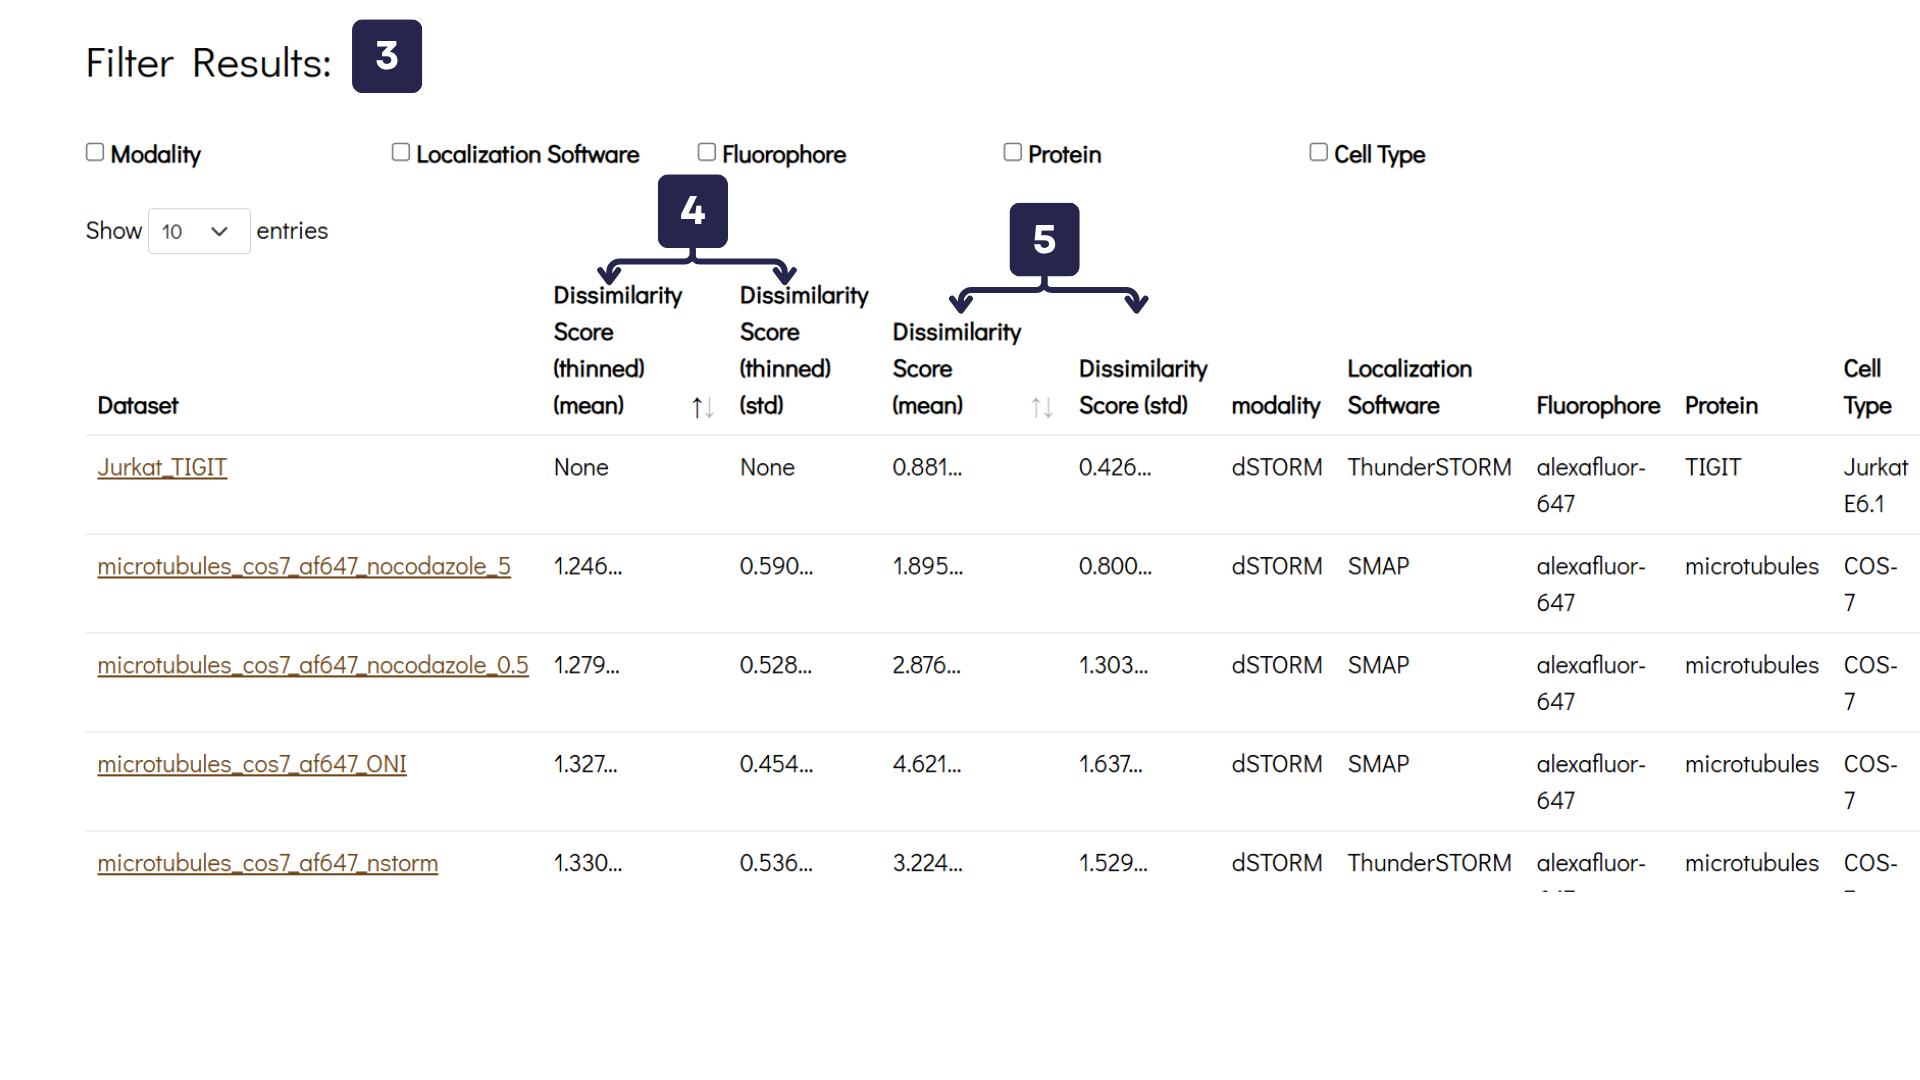
- Filter Buttons: The dissimilarity table allows users to refine results based on metadata tags.
- Thinned Dissimilarity Scores: Calculated for thinned data (30 localisations/μm²) to ensure scores remain independent of localisation density.
- Unthinned Dissimilarity Scores: Mean dissimilarity scores and standard deviations are provided, where higher values indicate greater differences between datasets.
Uploading Data
Registered users can upload their datasets to Nano-Org. Please complete the upload form as thoroughly as possible. Providing detailed information helps enhance dataset accessibility and improves filtering accuracy.
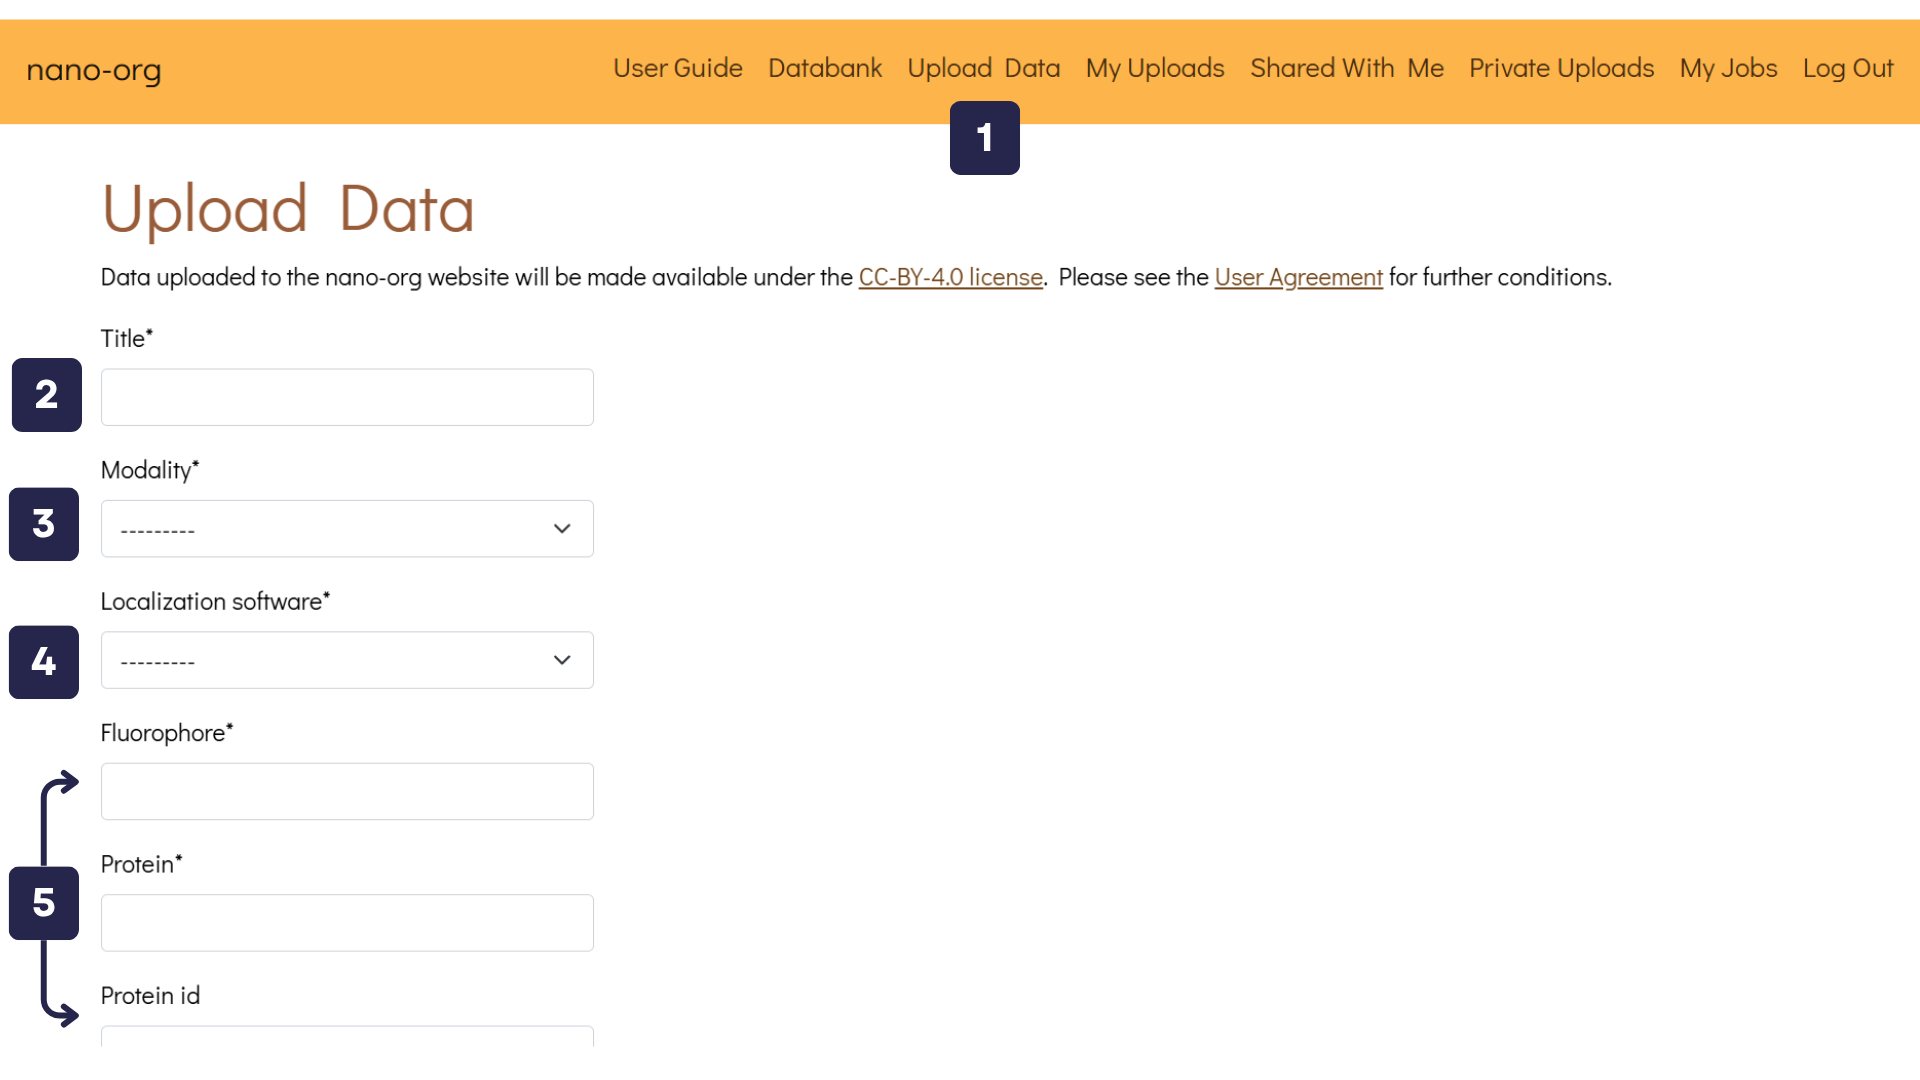
- Upload Data Button: Once logged in, you'll find the Upload Data button in the navigation bar. Clicking this button takes you to a page where you can upload files and describe your datasets.
- Title Text Box: Assign a unique title to your uploaded data, such as SPL76 mEos3.3 Jurkat on aCD3aCD28 5mins.
- Modality Text Box: Select the imaging modality used. Options include PALM, dSTORM, PAINT, and others. If you are uploading dSTORM data, you will be asked to provide details about the primary and secondary antibodies used, including their reference numbers.
- Localisation Software Text Box: Specify the localisation software utilised. Available choices include ThunderSTORM, SMAP, Picasso, DECODE, RapidSTORM, and others.
- Experimental Metadata Text Boxes: Enter relevant experimental details such as fluorophore type, protein name, UniProt protein ID (if available), cell type, and other relevant metadata.
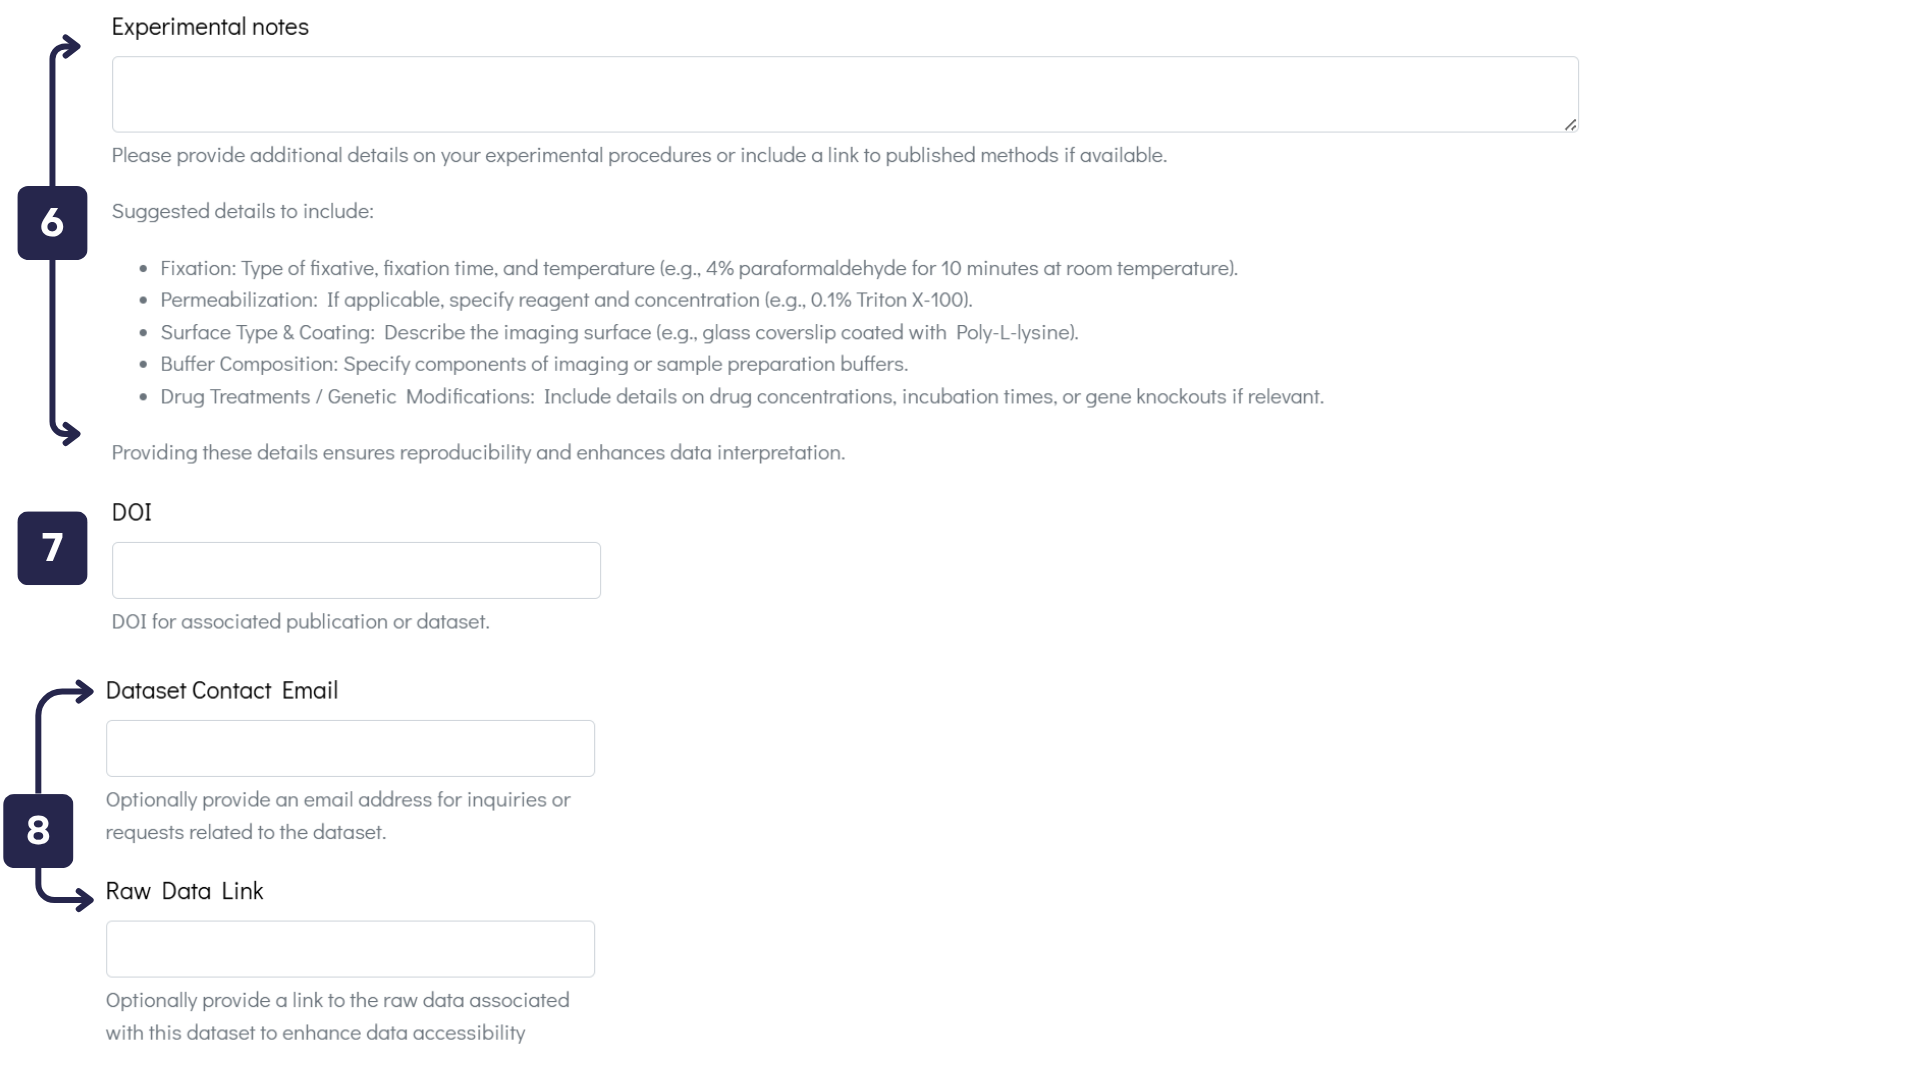
- Experimental Data Text Box: Provide comprehensive details about your experimental procedures to ensure reproducibility and enhance data interpretation.
- DOI Text Box: If your dataset is associated with a publication, please enter its DOI to facilitate citation and verification.
- Contact Details / Raw Data Text Boxes: To improve dataset accessibility, provide an email address for inquiries or include a link to the raw data.
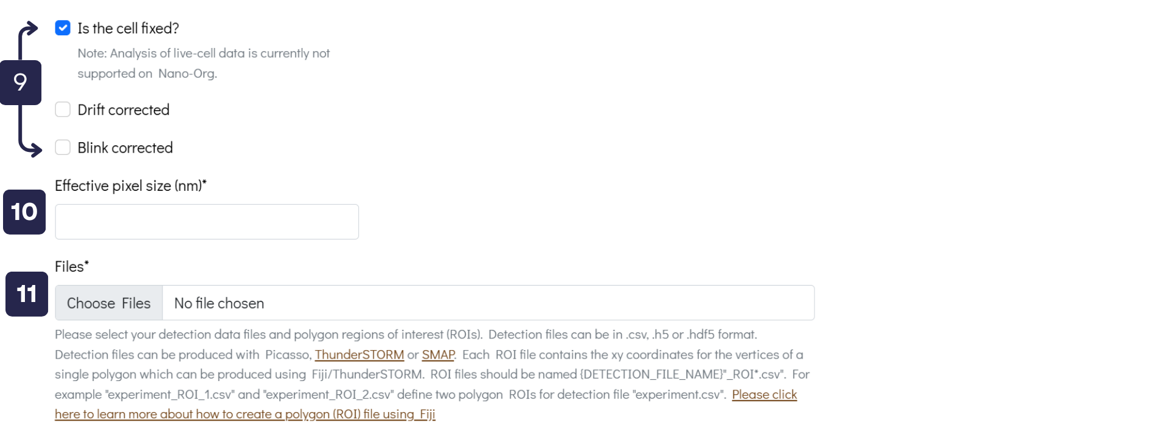
- Tick Boxes: Indicate whether the samples have undergone Drift Correction and/or Blink Correction. Note that nano-org currently supports only fixed-cell data and cannot analyse live-cell datasets.
- Effective Pixel Size Text Box: Specify the pixel size for your images, such as 100 nm.
-
Upload Files: Upload detection data files and polygon regions of interest (ROIs). Accepted
formats are:
- Detection data files:
.csv,.h5, or.hdf5 - ROI files:
.csv
{DETECTION_FILE_NAME}_ROI*.csv. For example,experiment_ROI_1.csvandexperiment_ROI_2.csvdefine two polygon ROIs for detection fileexperiment.csv. ROI files can be created using Fiji, and we provide a How to Create a Polygon Region in Fiji guide to assist you. - Detection data files:
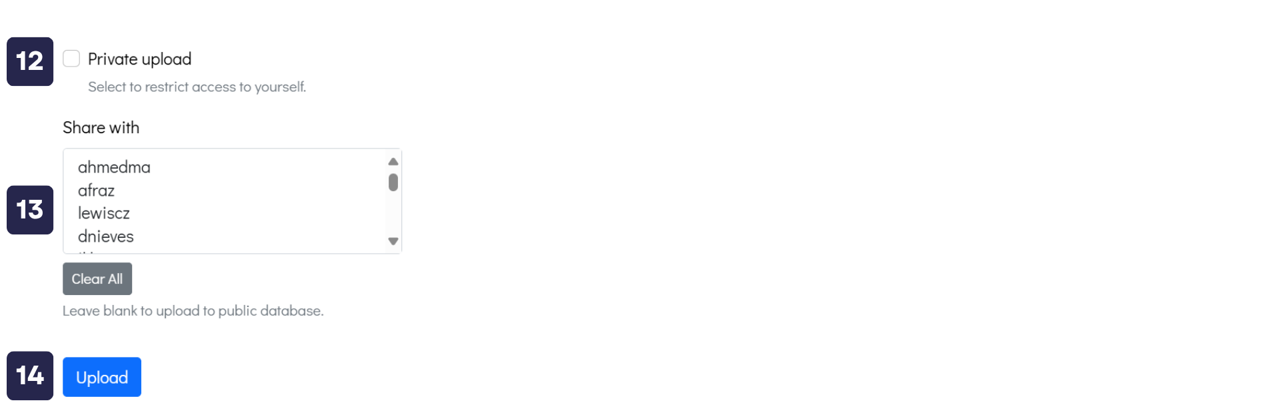
- Private Upload Option: Select this checkbox if you want to upload your dataset and keep it accessible only to yourself. You will still be able to use all analysis features on the website with your private dataset.
- Share with Specific Users: Alternatively, you can share your dataset with selected users by clicking their usernames under the “Share with” section. If neither this option nor the private upload box is selected, your dataset will be made publicly available to all registered users.
- Upload Button: Once you're ready, click this button to upload your dataset to nano-org.
Contact and Support
If you need assistance or have any questions, please use the following link to contact us: Contact us